Statistics
The SIM.JS library provides three utility classes for recording and analyzing statistics: Data Series, Time Series and Population.
Data Series is a collection of discrete, time-independent observations, for example, grades of each student in a class, length of rivers in United States. The DataSeries() class provides a convenient API for recording and analyzing such observations, such as finding maximum and minimum values, statistical properties like average and standard deviation and so on.
Time Series is a collection of discrete time-dependent observations. That is, each observation value is associated with a discrete time instance (the time at which the observation was made). For example, the size of queue at time t during the simulation run, number of customers in a restaurant at time t during evening hours. Note that the time instances when the observations are made are discrete. Also note the difference between Data Series statistics which records time independent statistics. The TimeSeries() class provides a convenient API for recording and analyzing such observations, such as finding maximum and minimum values, statistical properties like time-averaged mean and standard deviation and so on.
Population is actually a composite of the above two statistics, which models the behavior of population growth and decline. Consider a room where people may enter, stay for a while and then leave. The enter event will increase the population count, while the leave will decrease the population count of the room. For this room, we are interested in two statistics:
- The average population of the room. Note that this is a Time Series statistics (observation is number of people in room at some discrete time instance). The statistical information for the size of the population is contained in the sizeSeries attribute, which is an object of the TimeSeries() class.
- The average duration that people stayed in the room. Note that is a Data Series statistics (observations are stay duration for each person, and are independent of time). The statistical information for the stay duration is contained in the durationSeries attribute, which is an object of the DataSeries() class.
The Population statistics is used very often to study the behaviors of queues.
Data Series Statistics
Data Series is a collection of discrete, time-independent observations, and the DataSeries() class provides an API for recording and analyzing statistics.
An object of the DataSeries() is created for each observation set:
var studentGrades = new Sim.DataSeries("Student Grades");
var riverLengths = new Sim.DataSeries("Length of Rivers in US");
The observation values are recorded through the record() function. This function optionally takes a weight parameter to adjust the weight of the given observation:
studentGrades.record(3.0);       // Alice
riverLengths.record(2320.0);  // Mississippi (miles)
experimentData.record(1.5, 0.8); // Value = 1.5, Weight = 0.8
The DataSeries class computes statistical properties of the observation values, including count(), min(), max(), sum(), sumWeighted(), average() (mean), deviation() (standard deviation) and variance(). Data can be recorded as histograms via the setHistogram() function.
An example:
var data = new Sim.DataSeries('Simple Data');
for (var i = 1; i <= 100; i++) {
        data.record(i);
}
data.count(); // = 100
data.min();   // = 1.0
data.max();   // = 100.0
data.range(); // = 99.0
data.sum();   // = 5050.0
data.average(); // 50.5
data.deviation(); // = 28.86607004772212
data.variance(); // = 833.25
API Reference
- class Sim.DataSeries([name])
name is an optional parameter used for identifying the statistics in a report.
- Sim.DataSeries.record(value[, weight])
Records an observation value and an optional weight. If the weight argument is omitted, it is assigned the default value of 1.0.
- Sim.DataSeries.reset()
Resets the statistics. If a histogram was set earlier with setHistogram(), then the histogram settings (lower bound, upper bound and number of buckets) are retained, but the count for each bucket is reset to 0.
- Sim.DataSeries.count()
The number of observations recorded so far.
- Sim.DataSeries.min()
The minimum value from all observations recorded so far.
- Sim.DataSeries.max()
The maximum value from all the observations recorded so far.
- Sim.DataSeries.sum()
The sum of all observation values recorded so far. Note that this does not consider the weight for the values. See sumWeighted() for weighted sum.
- Sim.DataSeries.sumWeighted()
The weighted sum of all observation values recorded so far.
- Sim.DataSeries.average()
The weighted average of all observation values recorded so far.
- Sim.DataSeries.deviation()
The standard deviation of observation values recorded so far.
- Sim.DataSeries.variance()
The variance of the observation values recorded so far.
- Sim.DataSeries.setHistogram(lower, upper, nbuckets)
Prepares a histogram for recording frequency of occurrence of values. The histogram has nbucket number of buckets, spanning the range of [lower, upper].
Only the values that are recorded (via the record() function) after the histogram was created will be taken into account. It is therefore recommended that setHistogram is called before recording values.
If a histogram already existed by an earlier call to setHistogram, that previous histogram will be deleted. Also, as noted above, only the recorded values from this point on will be entered in the new histogram.
When the statistic is reset (via the reset() function), the DataSeries object will remember the histogram structure (the lower, upper and nbuckets values) but the values themselves will be reset to 0. That is, there is no need to call setHistogram after the reset function is called.
- Sim.DataSeries.getHistogram()
Return the histogram as an array. The size of the array will be (nbuckets + 2). The index 0 of the array counts the number of observations that were below the lower value (as defined in setHistogram()), the last index of the array counts the number of observations that were greater than the upper value.
Note
The returned array should be treated as read-only.
Time Series Statistics
Time Series is a collection of discrete, time-dependent observations, and the TimeSeries() class provides an API for recording and analyzing statistics.
An object of the TimeSeries() class is created for each observation set:
var queueSize = new Sim.TimeSeries("Queue Size");
var customers = new Sim.TimeSeries("Customers at Restaurant");
The observation values are recorded through the record() function. Each observation is a combination of (a) the value to record, and (b) the time when the observation was made. For example,
queueSize.record(0, 0); // size is 0 at 0 sec
queueSize.record(1, 1.5); // size is 1 at 1.4 sec
queueSize.record(2, 1.8); // size is 2 at 1.8 sec

customer.record(15, 1800); // 15 customers at 6 pm
customer.record(50, 2100); // 50 customers at 9 pm
customer.record(5, 2315); // 5 customers at 11:15 pm
Few notes on the semantics of observations: when an observation (v1, t1) is recorded, it means that the value of the system is v1, starting at time t1, and will remain so until the next observation is recorded.
For the customer example above, the observation will look like this:
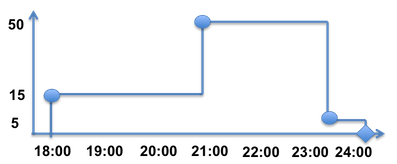
The three circles represent the three observations recorded. Note how the observations are discrete with respect to time.
Also observe that (v1, t1) record will not be “committed” until a next observation (v2, t2) is made (since only then we will know that the value v1 was applicable for the duration t1 - t2). The finalize() function can be used to commit the last observation.
The TimeSeries class computes statistical properties of the observation values, including count(), min(), max(), sum(), average() (mean), deviation() (standard deviation) and variance(). Data can be recorded as histograms via the setHistogram() function.
Note that the average, deviation and variance statistics are averaged over time.
API Reference
- class Sim.TimeSeries([name])
name is an optional parameter used for identifying the statistics in a report.
- Sim.TimeSeries.record(value, timestamp)
Records an observation value made at time timestamp.
- Sim.TimeSeries.finalize(timestamp)
Call this function after the last observation was recorded.
- Sim.TimeSeries.reset()
Resets the statistics. If a histogram was set earlier with setHistogram(), then the histogram settings (lower bound, upper bound and number of buckets) are retained, but the count for each bucket is reset to 0.
- Sim.TimeSeries.count()
The number of observations recorded so far.
- Sim.TimeSeries.min()
The minimum value from all observations recorded so far.
- Sim.TimeSeries.max()
The maximum value from all the observations recorded so far.
- Sim.TimeSeries.sum()
The sum of all observation values recorded so far.
- Sim.TimeSeries.average()
The time average of all observation values recorded so far.
- Sim.TimeSeries.deviation()
The standard deviation of observation values recorded so far.
- Sim.TimeSeries.variance()
The variance of the observation values recorded so far.
- Sim.TimeSeries.setHistogram(lower, upper, nbuckets)
Prepares a histogram for recording frequency of occurrence of values. The histogram has nbucket number of buckets, spanning the range of [lower, upper].
Only the values that are recorded (via the record() function) after the histogram was created will be taken into account. It is therefore recommended that setHistogram is called before recording values.
If a histogram already existed by an earlier call to setHistogram, that previous histogram will be deleted. Also, as noted above, only the recorded values from this point on will be entered in the new histogram.
When the statistic is reset (via the reset() function), the DataSeries object will remember the histogram structure (the lower, upper and nbuckets values) but the values themselves will be reset to 0. That is, there is no need to call setHistogram after the reset function is called.
- Sim.TimeSeries.getHistogram()
Return the histogram as an array. The size of the array will be (nbuckets + 2). The index 0 of the array counts the number of observations that were below the lower value (as defined in setHistogram()), the last index of the array counts the number of observations that were greater than the upper value.
Note
The returned array should be treated as read-only.
Population Statistics
Population models the behavior of population growth and decline. This class supports two basic operations:
- enter() to indicate that one entity has entered the system and the population has increased by one (birth event), and
- leave() to indicate that one entity has left the system and the population has decreased by one (death event).
Population itself is a composite of two statistics:
- Sim.Population.sizeSeries: a statistic of TimeSeries type which records the population of the system as a function of time.
- Sim.Population.durationSeries: a statistic of DataSeries type which records the stay duration of each entity.
Consider the following example:
var motel0 = new Sim.Population("Motel 0");
motel0.enter(1600); // one person entered at 4:00 pm
motel0:enter(1600); // second person entered at 4:00 pm
motel0.leave(1600, 1601); // one person who entered at 4:00 pm, left at 4:01 pm
motel0.enter(1630); // another person entered at 4:30 pm
motel0.leave(1630, 1700); // person who entered at 4:30 pm left at 5:00 pm

motel0.finalize(1700); // No more observations after this

motel0.current(); // current population = 1
motel0.sizeSeries.average(); // average population in motel
motel0.durationSeries.average(); // average stay duration in motel
API Reference
- class Sim.Population([name])
name is an optional parameter used for identifying the statistics in a report.
- Sim.Population.sizeSeries
A statistic of Sim.TimeSeries() type that records the size of the population of the system. Refer to Time Series for the APIs for this attribute.
- Sim.Population.durationSeries
A statistic of Sim.DataSeries() type that records the stay duration of the entities. Refer to Data Series for the APIs for this attribute.
- Sim.Population.current()
The current population of the system.
- Sim.Population.enter(timestamp)
An entity has entered the system at timestamp.
- Sim.Population.leave(enteredAt, leaveAt)
An entity that entered the system at enteredAt will leave at leaveAt.
- Sim.Population.finalize(timestamp)
Call this function after the last observation was recorded.
- Sim.Population.reset()
Resets the statistics.